
Social Explorer is well known for its maps. But many users want data available in a tabular format, either for display or to export it so they can work with it outside the Social Explorer software.
Recently, we decided to overhaul the Tables capability in our award-winning demographic mapping software to support these important user needs, adding functionality and making the access we provide to tabular data more user friendly.
In this article, we’ll take you through the highlights of what we are calling the new Reports application.
If you’re a Social Explorer subscriber, you can access the new Reports feature using this link. It’s also findable in the Social Explorer software via the Tables item in the main menu.
For those who don’t have access to the software, all the examples cited below should give you a sense of what the new Reports interface looks like and what its capabilities are. You can also sign up for a free trial to give it a try.
Social Explorer Reports Overview: The New User Interface
The new Reports application has a user interface reminiscent of the updated application interface whereas the old Tables functionality — which is still available through Social Explorer — continues to use the old interface.
Building a Report follows the same basic steps as building a Table — select your survey, specify your geographies, and determine your variables — but it does so via a progressive, step-by-step form that is more intuitive than the old Tables interface.
The two most significant updates to the user experience, which are designed to help speed up analysis, are the new search feature and a set of pre-made Reports that you can apply to your area of investigation.
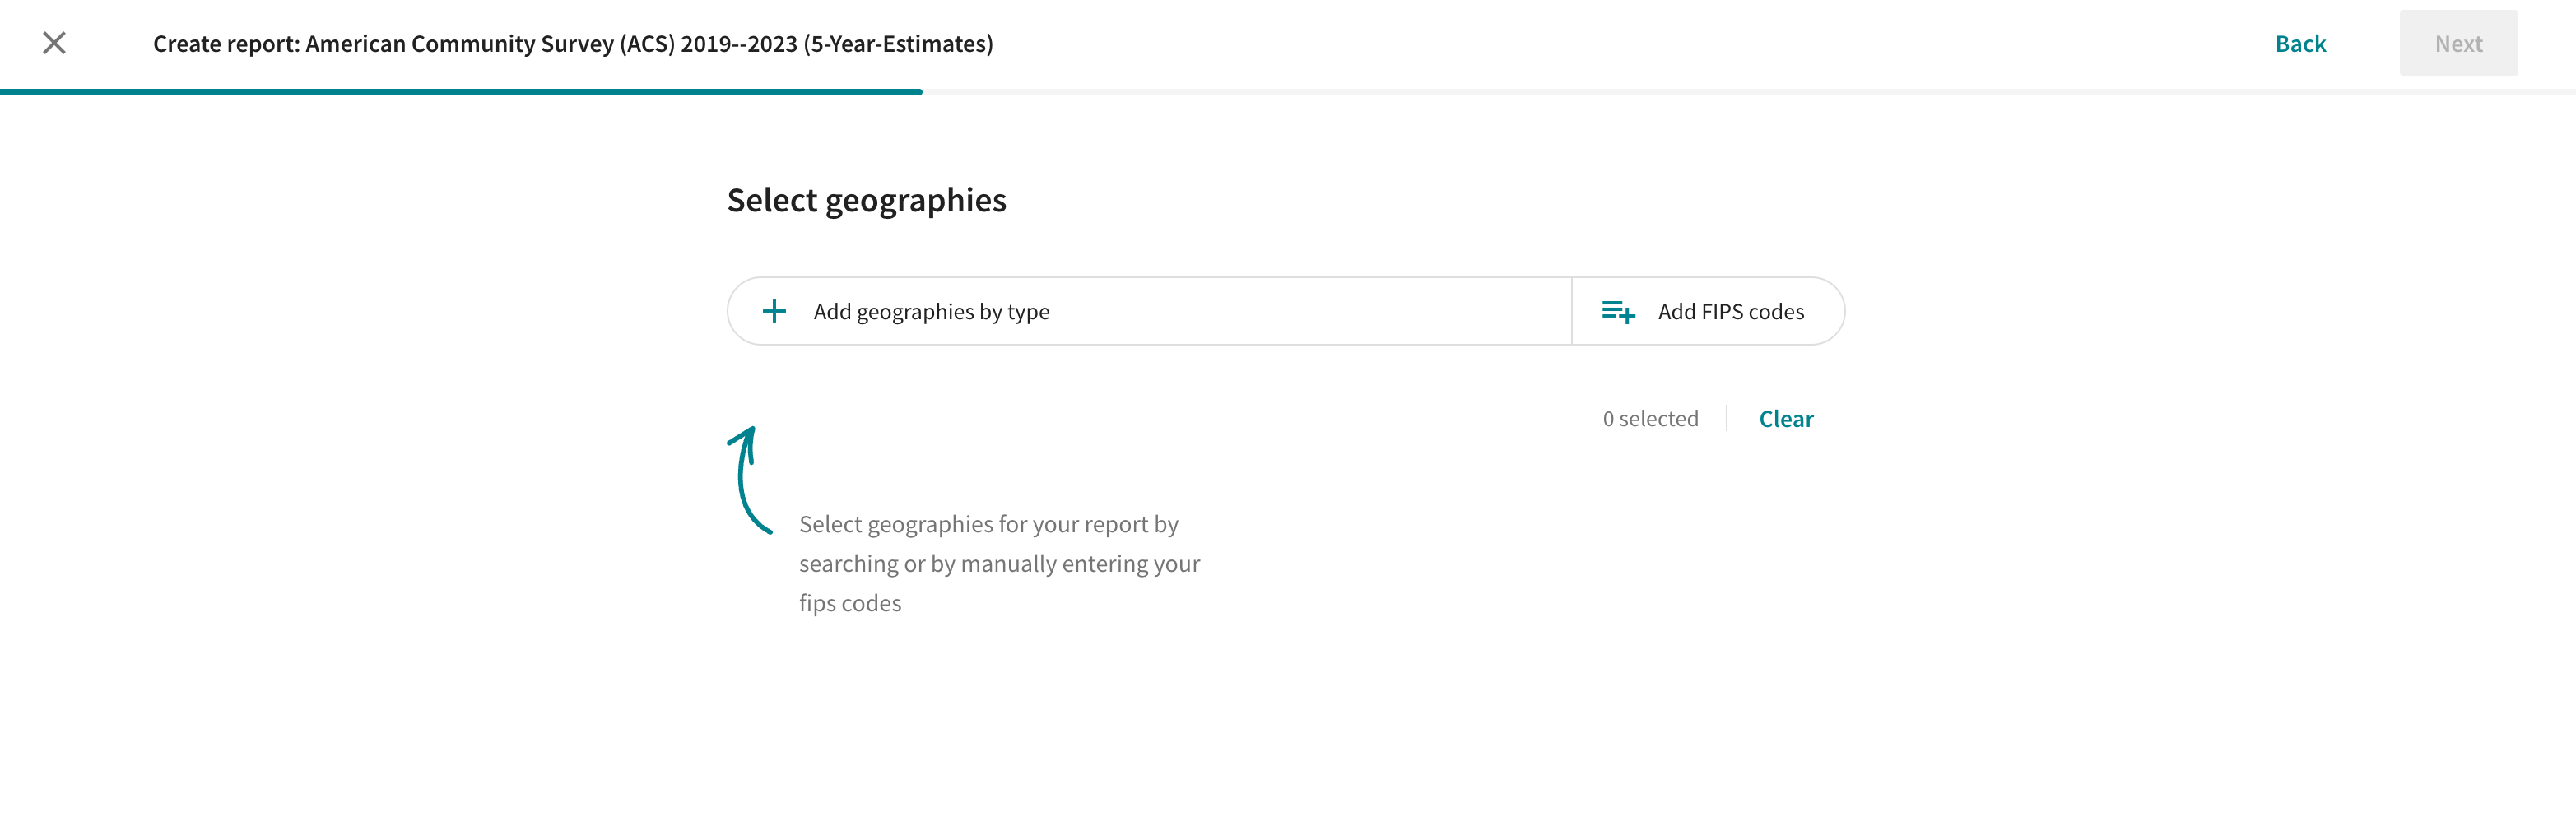
Search for Geographies and Variables
In the new Reports application, users can search the geography and variable menus by keyword, as opposed to having to scroll through the lists to isolate specific data points for analysis. This makes it a lot easier to build Reports if, for example, you don’t know the FIPS code for a geographic entity, or you don’t know that the A14028 Gini Index of Income Inequality variable in the American Community Survey is found nestled in between variables devoted to housing.
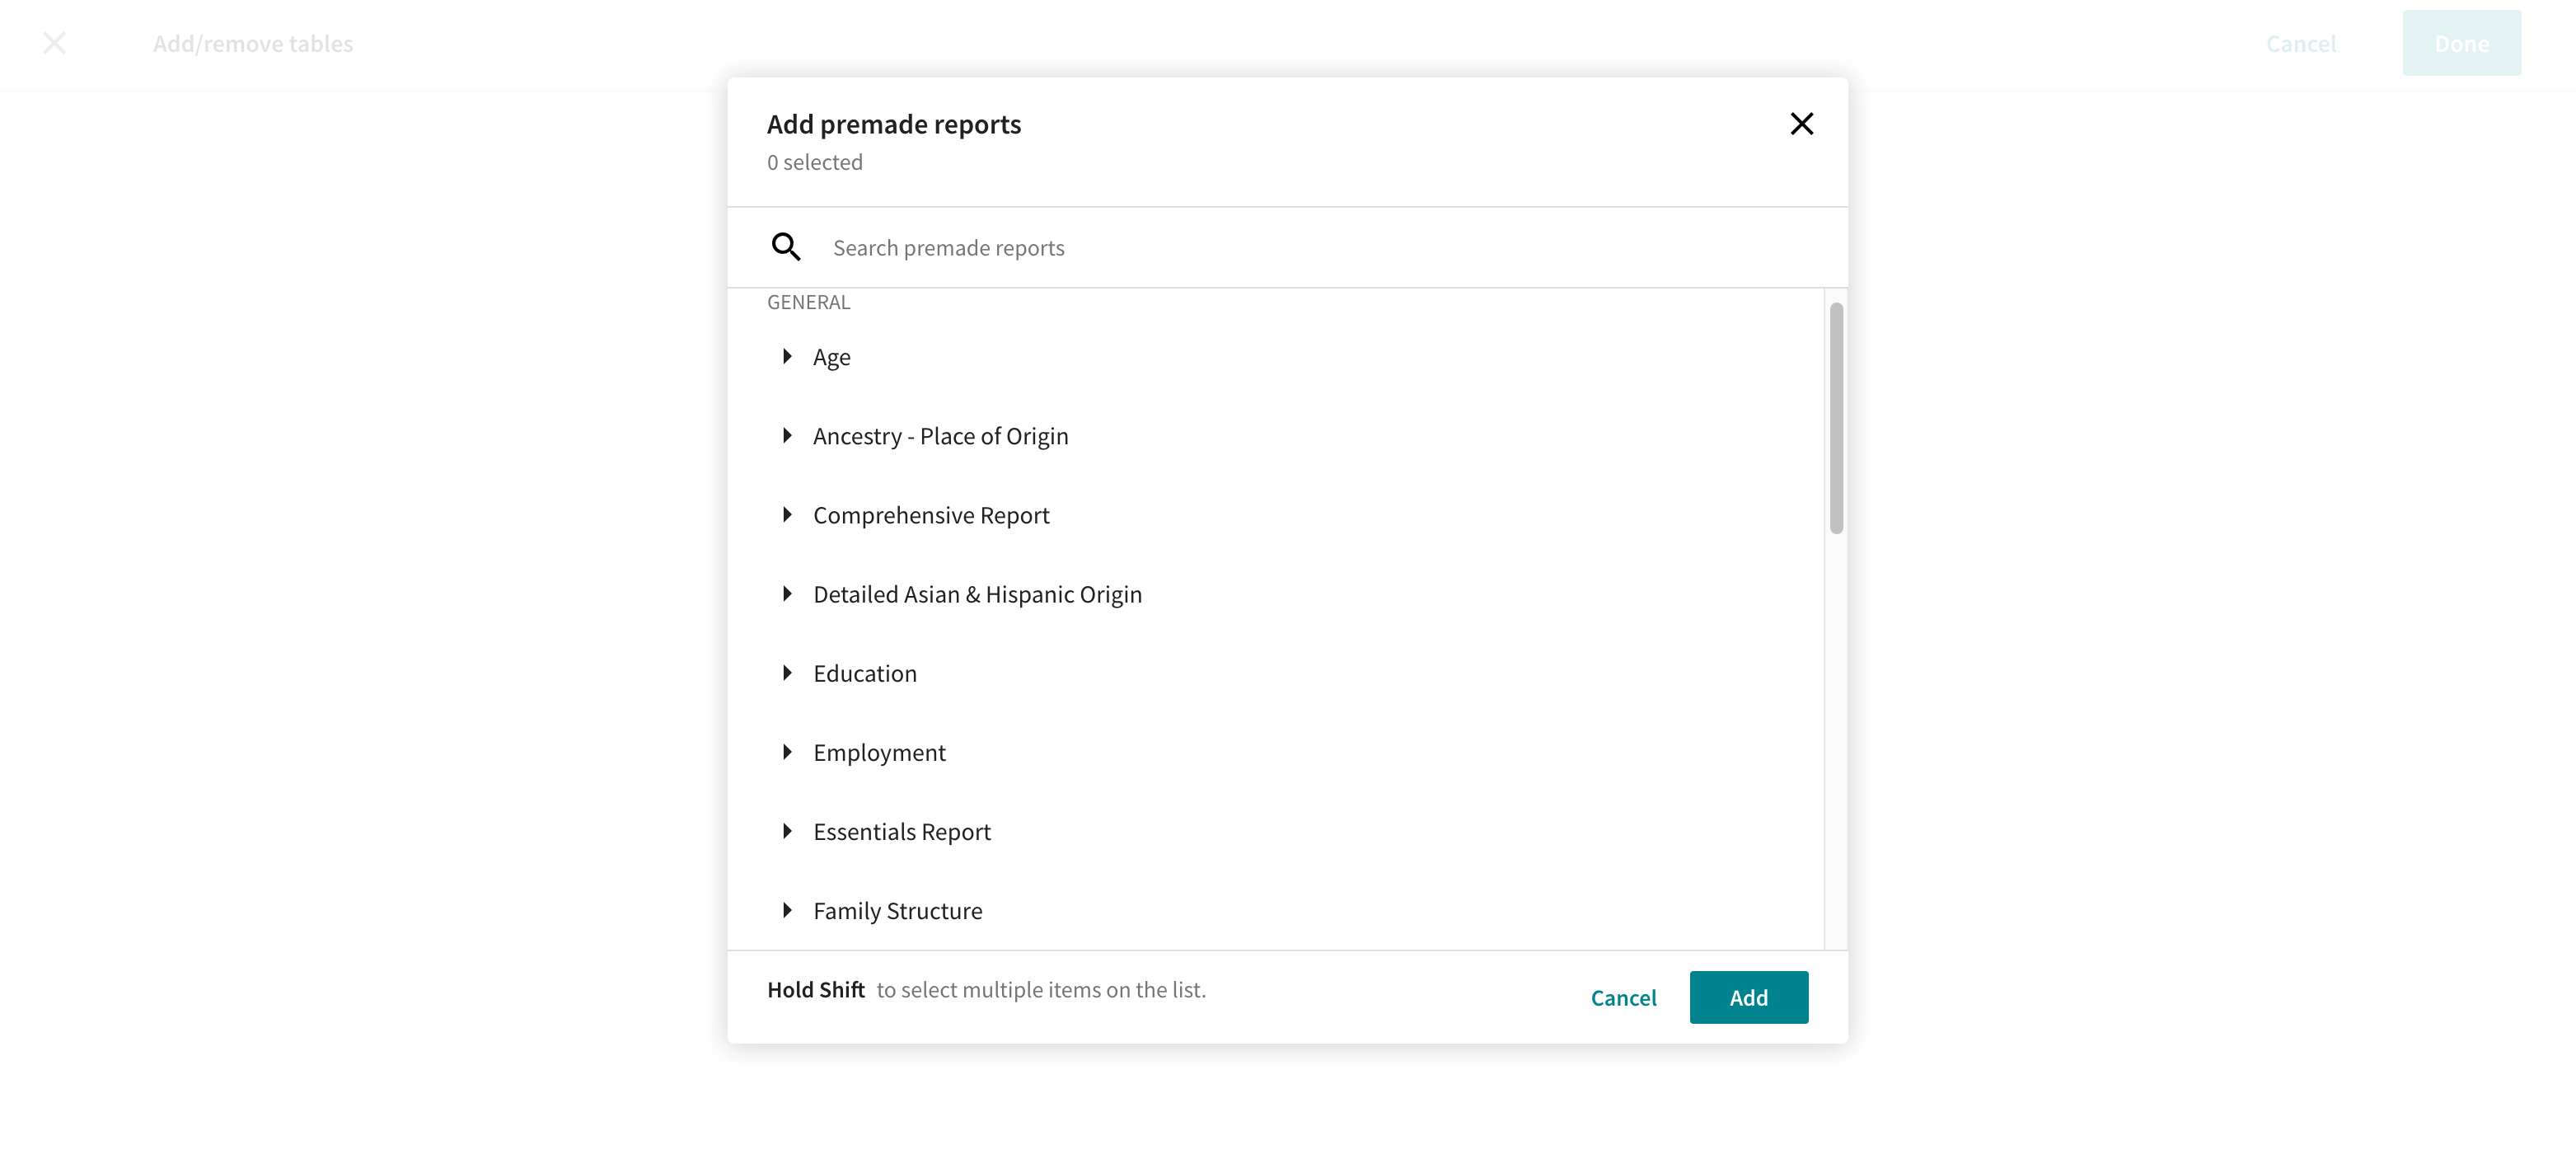
Pre-Made Reports
The new Social Explorer Reports includes a number of pre-made Reports Templates you can run after specifying a geography. Choose from Templates that cover areas of analysis such as:
- Age
- Ancestry - Place of Origin
- Education
- Employment
- Family Structure
- Housing
- Industry, Occupation & Employment Sector
- Income
- Means of Transportation & Travel Time
- Poverty
- Veteran Status and Era of Service
Each of these Reports Templates includes multiple, pertinent variables, giving users a quick way to explore these topics in depth. And if a specific variable you want to isolate isn’t present in a pre-made Reports Template, you can easily add it by searching for the missing variable and appending it to your table.
Comparisons in Social Explorer Reports
Comparison is a critical feature of analysis. But the old Social Explorer Tables application could not compare data in tables. The new Reports addresses this issue by giving users the ability to compare data across timeframes and geographies, provided that you are looking at the same variables within the same data set. Here’s how these comparison functions work.
Compare Timeframes
Working with the data from a single survey, you can now compare up to three timeframes in a single table, which allows you to study change over time easily within the Social Explorer software.
For example, say we wanted to test the hypothesis that the population of the Nashville metropolitan area is becoming younger since news outlets and bloggers have often touted Nashville as a great city for Gen Z, Millennials, and young adults over the last few years.
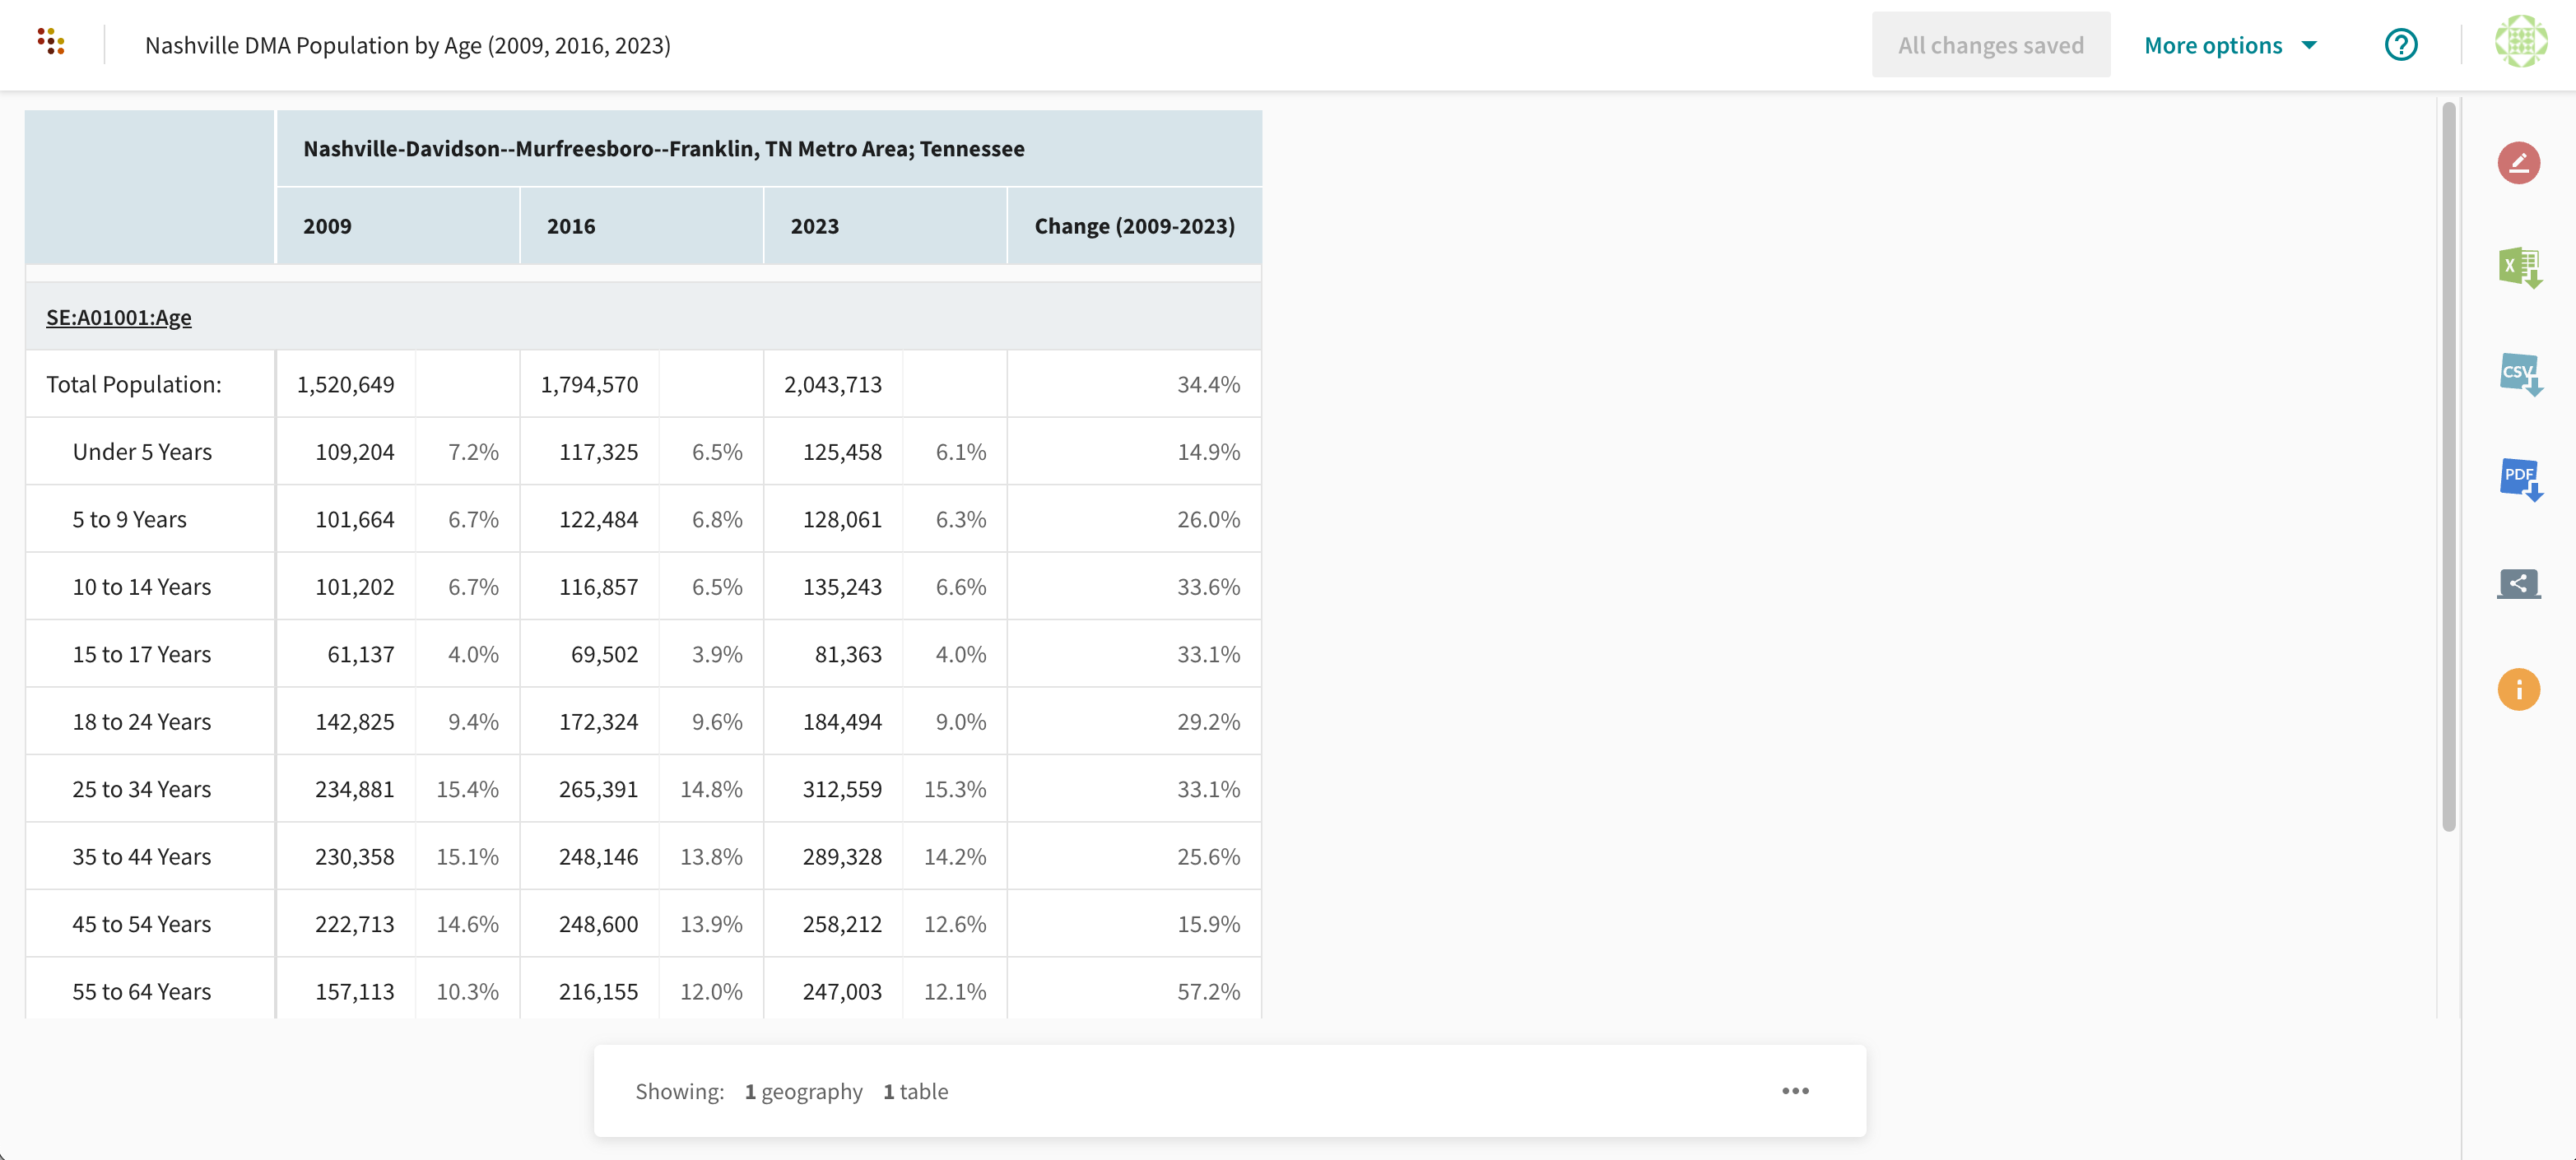
To do so, we can turn to the American Community Surveys (5-Year Estimates) dataset, isolate the Nashville-Davidson--Murfreesboro--Franklin, TN Metro Area and generate a table displaying population by age (SE:A01001:Age) using three years: 2023 (the newest survey available), 2009 (the year before the devastating flood of 2010 and the start of Nashville’s “explosive growth” due to extensive corporate expansion and relocation plans), and 2016 (the midpoint between 2009 and 2023).
Here’s what this table looks like in the new Reports application.
(To explore the table yourself, click on this link.)
What we find is that the population of young adults (including the 18–24 and 25–34-years rows in the Report) are definitely growing in terms of absolute numbers. But their rates of growth (33.1% and 25.4%, respectively) pale in comparison to the growth rate for the 55–64 and 65–74-year age ranges (which have grown at the rate of 57.2% and 102.1%, respectively). Conclusion? Nashville may also be a great city for the “young at heart.”
Compare Geographies
In the old Social Explorer Tables application, you were unable to compare geographies. Now you can in the new Reports, provided that you are working within the same survey.
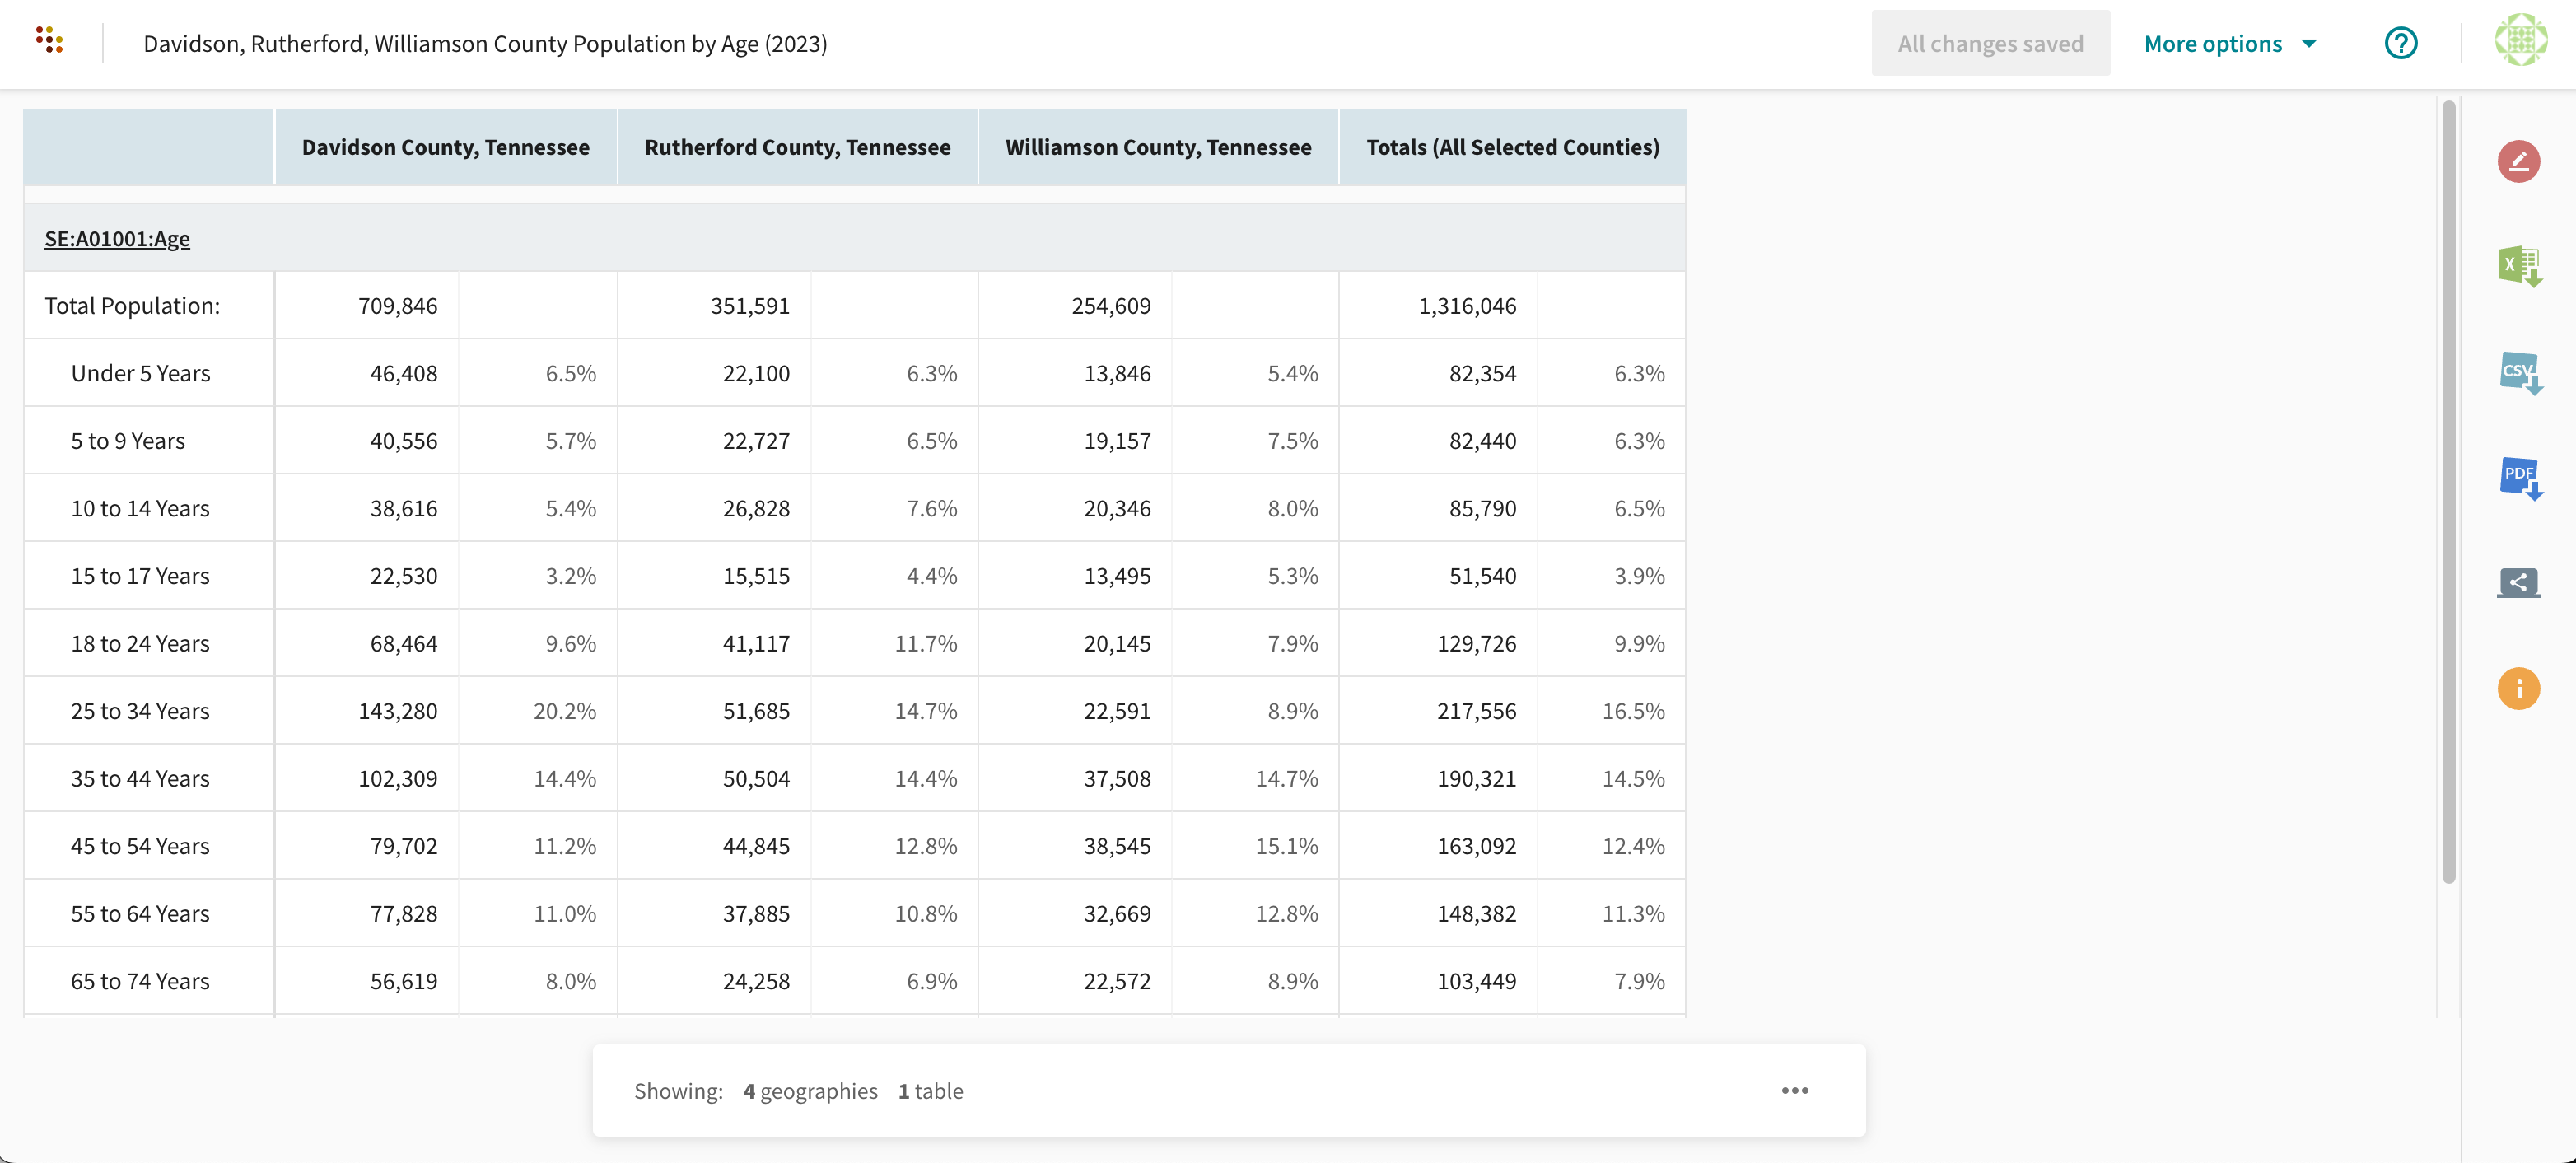
For example, if we wanted to continue our analysis of the Nashville area, we might look at the population age in Davidson county (where Nashville proper is located), Rutherford county (where Murfreesboro, a significant mid-size city in the Nashville DMA is located), and Williamson county, which includes the historic city of Franklin and has been experiencing a population boom.
Below is the table comparing Davidson, Rutherford, and Williamson county populations by age in 2023, generated via Social Explorer Reports.
(You can also interact with the table directly by following this link.)
Immediately, it’s evident that most people in each of our age ranges live in Davidson county. What is interesting, though, is that significantly fewer people in the 25–34 and 35–44-year-old age ranges live in Williamson county vs. Rutherford county. While the two seem evenly split for the 55–64 and 65-74-year age ranges, Rutherford is a more popular Nashville suburban destination for the younger sets. Maybe local news outlets should start talking up Murfreesboro not just as one of the fastest growing cities in the country but as a destination for young people?
Templates in Social Explorer Reports
A great new feature of Social Explorer Reports that promises to save a lot of time for those processing tabular data is the ability to create Templates.
Essentially, Templates let you establish a “lens” consisting of a set of variables, which you can then apply over and over again to different segments of a dataset. Above, we looked at some of the pre-made Templates that are available. But users can also create their own.
In the Nashville example we’ve been elaborating on, each of the Reports cited was created using a simple Template built around isolating the SE:A01001:Age variable from the American Community Survey (5-Year Estimates) dataset. That “lens” was applied repeatedly to the different timeframes (2009, 2016, 2023) and geographies (Nashville DMA, Davidson county, Rutherford county, Williamson county) in order to conduct the analysis, instead of having to build each of the Reports from scratch.
Outputs from Social Explorer Reports
As with the old Tables application, all tables generated using the new Social Explorer Reports application can be downloaded in Excel, CSV, SAS, SPSS, and tabular STATA files.
You can also generate links to share Reports online with users who do not have Social Explorer accounts (see the bolded hyperlinks above to view some sample links).
A new format available for output is PDF. Portrait or landscape formats can be specified, giving users an easy way to share tables offline and incorporate them into presentations.
Social Explorer Reports: In Summary
The Social Explorer Reports application improves on the old Social Explorer Tables by adding some key functionality:
- A better user interface
- The ability to compare data over time, as well as across geographies
- Templates that make building Reports that look at the same variables easier
- PDF exports
To start using these new features, simply log in to your Social Explorer account and visit the Tables section of the software.
If you don’t have an account, you can sign up online or request a demo with a member of our team.